Building Portolan: FIRMS MirrorMore than 600 million fire detections on one timeline
كل المقالاتهذه المقالة متاحة بالإنجليزية فقط. بقية الموقع مترجمة.
Welcome to the second post in the 'Building Portolan' series! For this one I've been working with the NASA FIRMS data - a really incredible dataset with 25+ years of fire data collected by a number of satellites, that gets updated several times a day. I've spent more time on this cloud-native geo conversion than I was planning, but have learned a ton along the way. There's a lot more that I want to do, but I decided I need to cut myself off from building and shift to writing about it, or it'd end up as my longest blog post ever. Following my structure from last time, I'll start with an overview, then dig into gory details, and end with some higher level reflections.
Cloud-native FIRMS overview
So when I went into building this catalog my goals were pretty modest - I mostly just wanted to make it a bit easier to get bulk access to the FIRMS data. At Planet I helped out integrating FIRMS into a customer demo for one of our projects, and they liked it as an integrated data source. I started thinking about bringing it into our data pipeline, and then realized there's no good reason to keep that within Planet - if I built the pipeline to get it into GeoParquet in public then it'd be easier for us to integrate in our pipeline. But far more people would then be able to benefit from it if I published it publicly, as a Portolan catalog. And almost as an afterthought I decided to put up a custom viewer to play with some of the aggregation ideas I've been pursuing:
A screen recording pans and zooms a dark world map covered in pentagon cells. The cells shade from blue to red by how many fire detections each one holds. A timeline along the bottom shows a bar for each day.
It showed a lot of potential and, after more iterations than I was expecting, I believe it's now a great demonstration of just how far you can push things with cloud-native geospatial techniques. I'll dig into those later in the post, but first a bit more about what you're seeing. The FIRMS data archive is about 10 gigabytes of data on every potential fire captured by different satellites. It's updated several times a day as new satellites capture images, and a lot of critical applications rely on it. They have a really nice default viewer, one of the more responsive ones that I've seen with this amount of data:
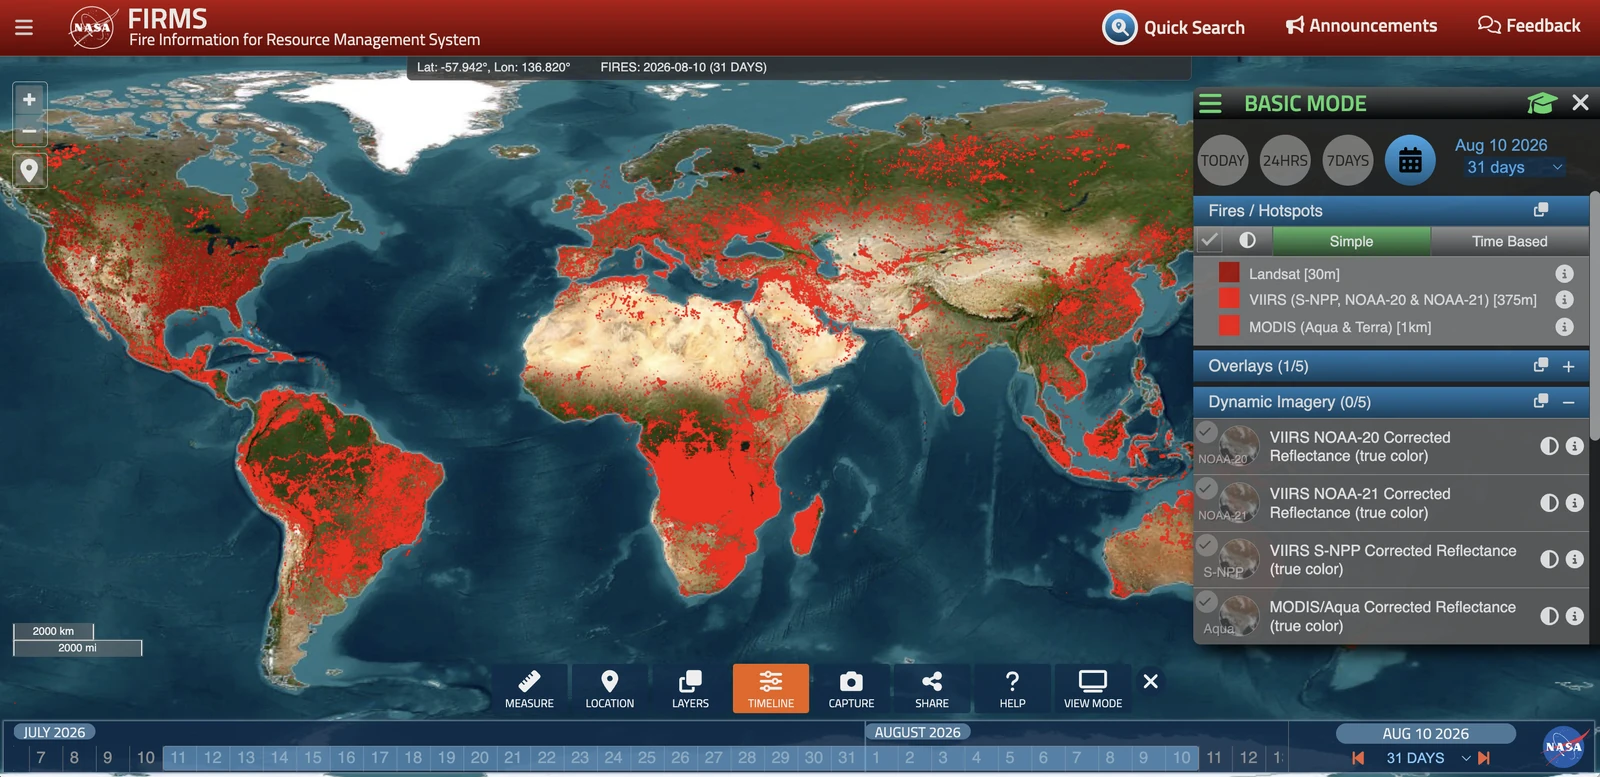
But the time selection caps out at 30 days, and the density of points also kind of saturates the map so it's hard to really tell where the data is used. So I wanted to see if I could make an application that is more responsive, using only Cloud-Native Geospatial formats. Mostly PMTiles, though I experimented some with GeoParquet in the mix. The big difference is an embrace of gridded aggregations at multiple zooms to show complete overviews of the data instead of the typical 'thinning' approach.
A screen recording zooms into a map layer. At the start only a few shapes are drawn. More of them appear at each zoom step, until the full set is on screen.
This technique of thinning works quite well - it's what enables you to look at a 200 gigabyte file and have it continuously load in seconds as you zoom and pan around. If you have an attribute in your data that corresponds to 'importance' then it works really well (FIRMS does have confidence & fire radiative power, so I will likely do a 'thinning' layer at some point), but even then it can often happen that you don't see an area of the map with data because it was too thin at lower zoom levels. But for me the biggest issue with the thinning is that you can't drive analysis from it - the browser only has a subset of the data, so any attempt to total up the values of your data will be skewed in whatever way you decided to thin, and often wildly wrong.
It also can really skew the time dimension, which to me is super important to get right. You can easily use PMTiles to drive time sliders by stacking columns to represent each time slice, but the time slider will only be populated by the data in your current view. And if you've done a lot of thinning then it will likely not be that representative of the actual time distribution.
So the solution I'm really liking lately is to aggregate to a grid, where you can have each cell contain totals of the actual data. I used A5 , a new Discrete Global Grid System (DGGS) based on pentagons, but H3 or S2 or anything else works equally well (and admin-partitioned can work too, showing true country stats). I did a lot of tweaking between the data and the front-end to get the performance right, but I believe the result is quite compelling, as you can 'zoom in' both temporally and spatially. You go down to the full points from the aggregates, and down to daily time slices, anywhere in the 25 year history of data.
A screen recording drags the ends of a timeline that spans 2000 to 2026. The bars under it change from one per month to one per day. The pentagon cells on the map above redraw at each step, and individual detection points appear once the window is short enough.
I don't believe this is yet a super useful fire map, as my focus was really on displaying the huge amounts of data in a responsive environment, and I'm not a routine user of FIRMS data. But after playing with different techniques I'm pretty confident that it should be possible to put more filters in, so if I get feedback / interest I'd be happy to try out another round of improvements.
And since this is on the Portolan blog I should at least share some about the actual FIRMS Portolan catalog , which is arguably the part that's most clearly useful today. The entire FIRMS archive is now available as year-partitioned GeoParquet files, along with a 'latest' file of the last seven days, that you can now query as one complete dataset. And there are yearly PMTiles with the aggregates built in (they drive the app). These can be accessed without API key, and should enable much easier bulk access to the data. It's one of the first 'updating' Portolan catalogs, that stays in sync with the source data. And with GeoParquet you can treat the entire set of data, including the latest updates, as one set of data. Today that means downloading and stitching together several files.
The gory details
So this section aims to go deeper into the technical side. If you just want the high level information then feel free to skip it. I'll start with the actual data and Portolan catalog, and then go into interesting bits of the explorer application.
The FIRMS Portolan catalog
So this catalog is modest from the diversity of data standpoint, as it's just one dataset. But I think there's a few interesting aspects. The first is actually the decision to make it one dataset. The downloads divide it up into the different sensors, and make regional downloads available.
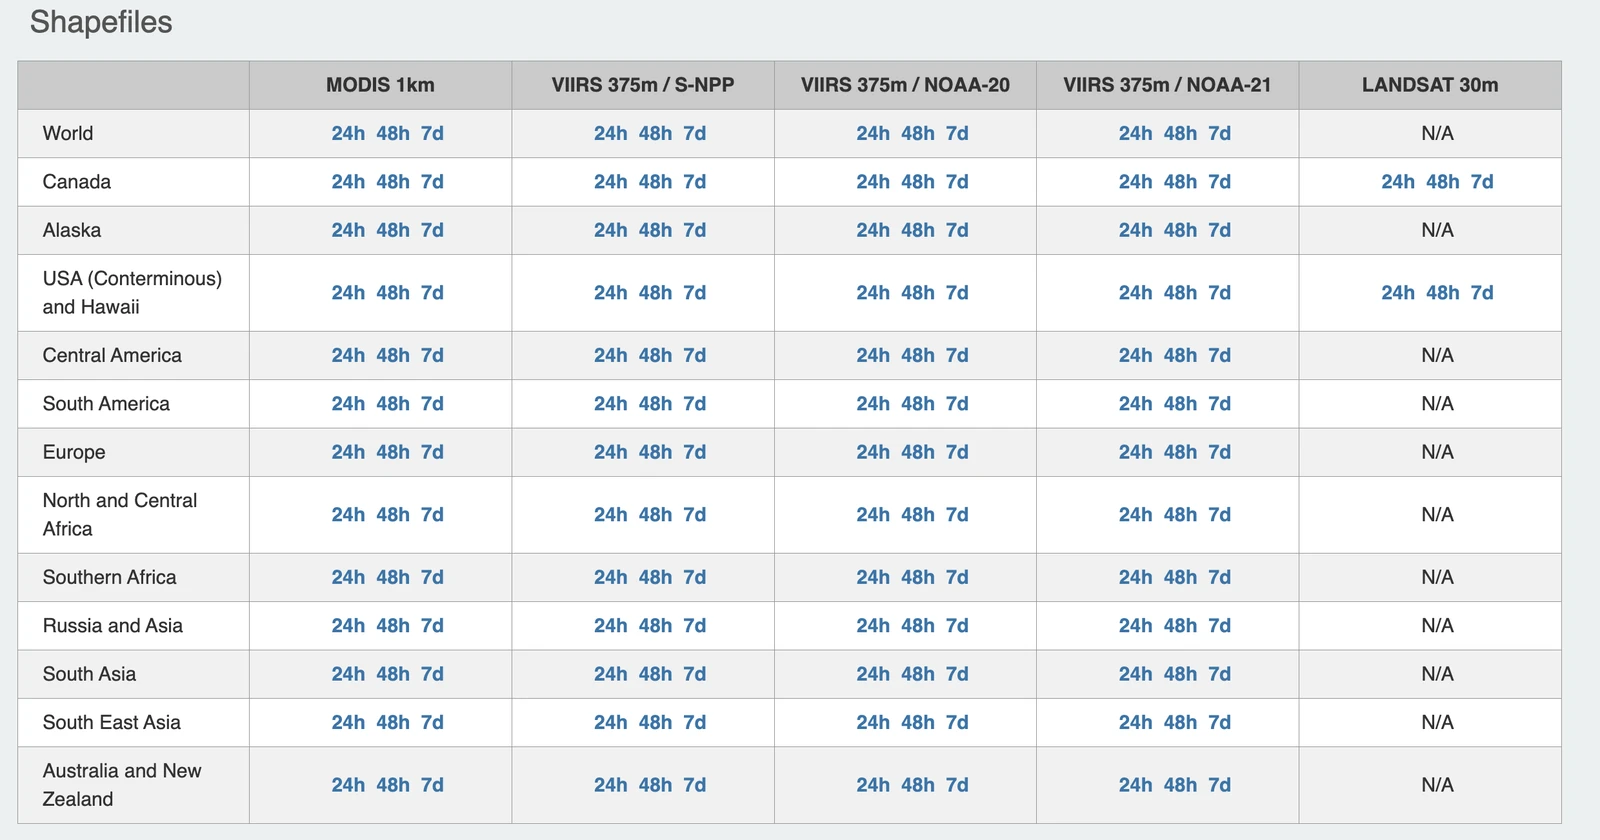
I decided to put them all in one set of data, since they all share the same
schema and then you can easily filter for which one you want. I did a 'hive
partition' (the year=2005 style directories) which lets parquet clients fully
skip the folder if the query is made with a year parameter.
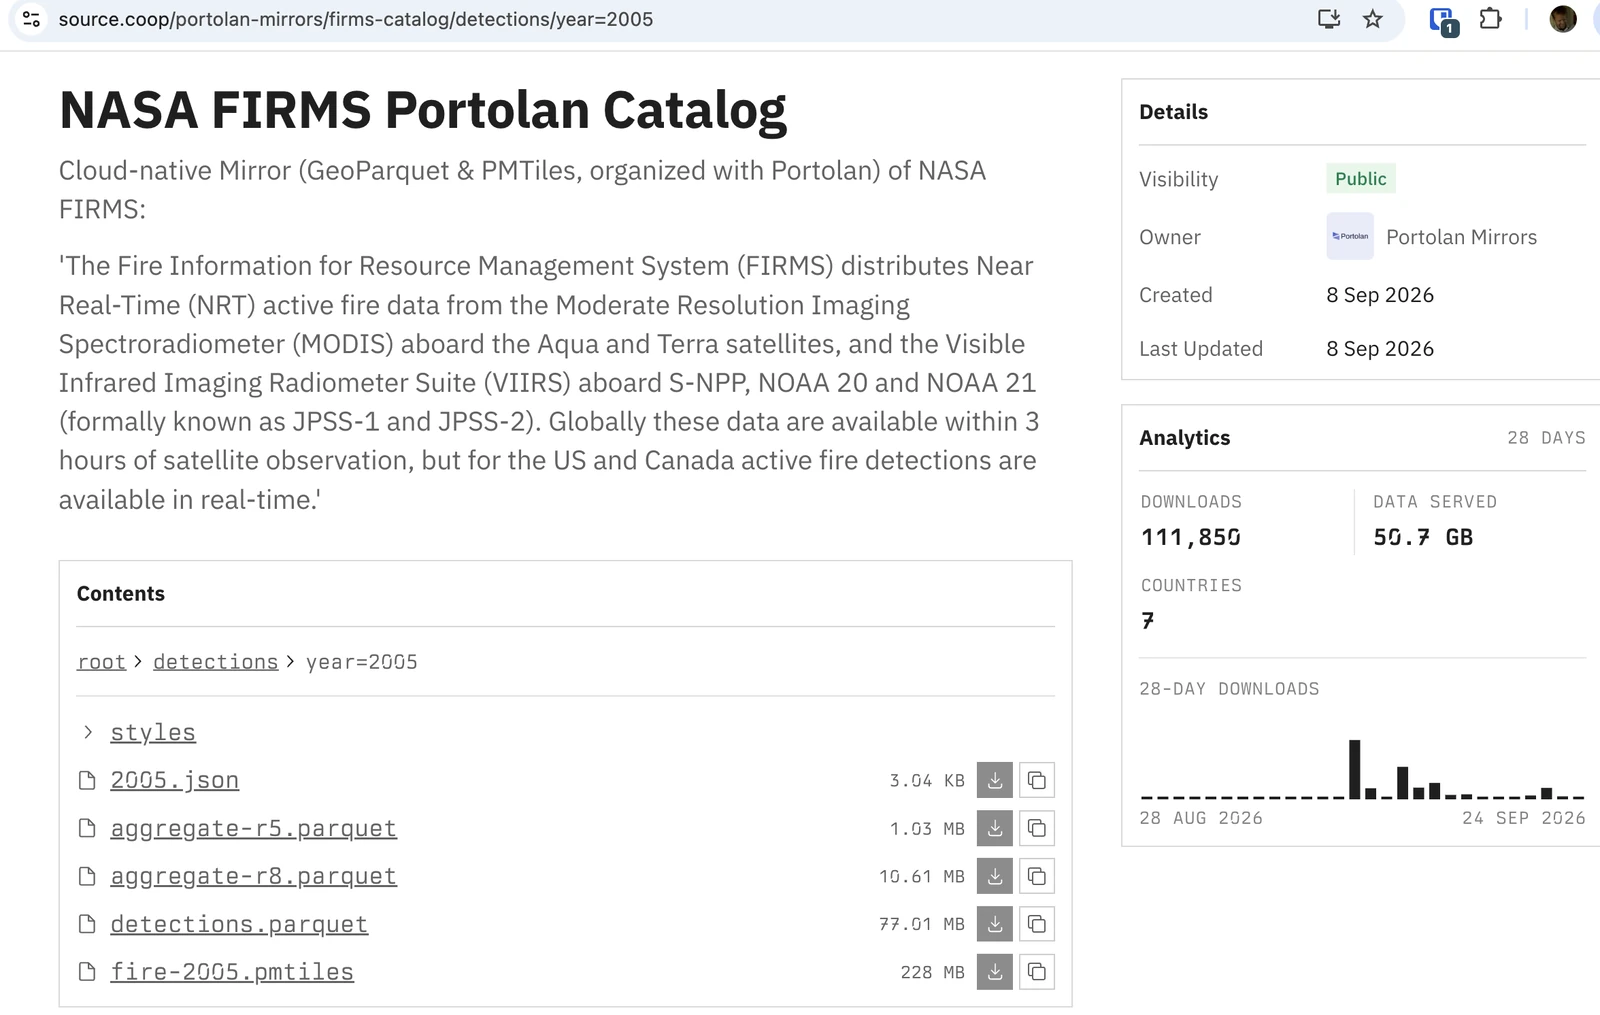
The general advice is to break things up if the file is over 2 gigabytes, and this total set of data is just shy of 10 gigabytes. You generally want to partition by the parameter that will be most often used for querying, and with global temporal data it's generally a bit of a toss-up which way to partition. I went with temporal splits in part because I knew I wanted a timeline that reads from the data while displaying globally, to get a sense of every fire happening in the world. If I split spatially then each view would have to pull in all the spatial parts. But both could work, especially for the parquet partition.
I may make an admin-partitioned version of the data at some point, so that you can browse to each country and download it fully. But right now I'm more interested in trying to create that experience by just creating country parquets on the fly, which should be possible. And if it works it'd enable conversion to different formats (GeoPackage, etc) and also arbitrary bounds. Hopefully I'll get some time for that in the next couple of months.
Alongside the yearly parquets and PMTiles I also included A5 aggregation
parquets at resolutions 5 and 8. These go into the PMTiles, and the
visualization reads from them. In my initial experiments I just threw these away. But this
time I left them in, and added examples to the agents.md file that Portolan
requires, so that AI agents can answer relevant questions directly from the
aggregates instead of scanning the full files, which should make some questions
much faster to answer. Creation of aggregations is now quite easy, using gpio
process aggregation tools
released a couple months ago.
Near real time updates
The other 'first' for me with this dataset was to have it be constantly updating. There were some early prototypes of doing versioning and syncing as part of Portolan, but for the first public release we decided to cut scope on those in favor of doing more experimentation and figuring out what should actually go in the spec vs in tools. The main use case is to stay in sync with datasets on ArcGIS Servers and GeoServers, but this was a more straightforward situation to handle.
The FIRMS fire data feed is updated several times a day, as the data comes from a few satellites that pass over fires at different times, with varying amounts of processing time. The feed has a nice straightforward API that makes it easy to grab the latest. I like things to be as simple and static as possible, so I went with a git-backed catalog on GitHub, where I could use GitHub Actions to stay in sync with the API. This lets me have a regular job that checks the latest data from the FIRMS API, updating several times per day, all for free with GitHub's continuous integration infrastructure.
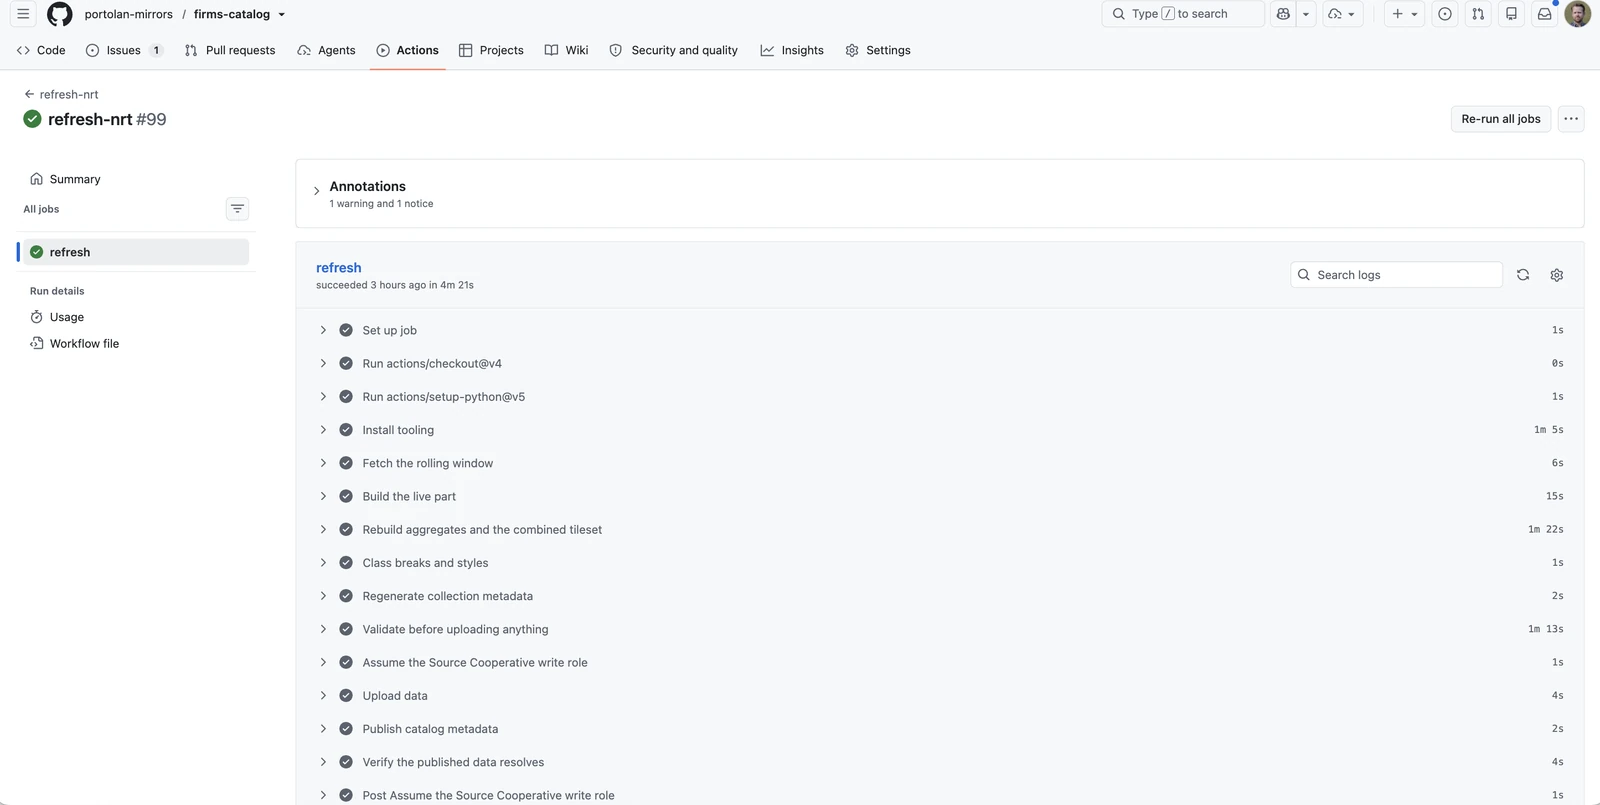
Since it's just using the free runners it doesn't always run hourly, but it usually gets an update every 3-5 hours. A more professional version could pretty easily pay for periodic instances for a few dollars a month.
I kept the same pattern that the core data feed did with the data, making a parquet file for the most recent 7 days, a smaller file for anyone who only wants the most recent fires. The update scripts move the older data into the year file, and one call still returns the whole dataset - the historical along with the most recent. I did a bit of adjustment to the schemas to have this work, but generally it's pretty true to the source data.
Exploring 25 years of data in the browser
Setting up the catalog was relatively straightforward, so most of my time on this project went to seeing how far I could push the front-end. My goal was to make it so the core files powering it are generally useful in other tools, while making my front-end tool as interactive as possible. I ended up with an 'all-time' PMTiles that had monthly columns for the statistics, and then one PMTiles for each year that has a column for each day. Then in my front-end I managed to get it so that all the parts integrate on the timeline, loading each bit iteratively as you interact with it. When you zoom out on the slider it switches to months, and when you get to the end of a year it loads the next year.
This is potentially abusing PMTiles a bit, as it makes the tiles heavier than they would be otherwise. Leveraging the A5 aggregations at coarser zoom levels lets us balance it the other way, as you need the full 365 columns per geometry per tile, so if you have less geometries per tile then the total size can be less. But the map looks much nicer if you have smaller cells, as you can see much more spatial nuance.
The front end would struggle if I loaded it up with too much data, since I wanted it to update the map as you drag the time slider. I just love that responsive interaction, I feel it lets you get a much better sense of the data, but it requires a lot of computation and it took a few iterations to find the right balance between spatial resolution and the temporal interactions. I went with A5 resolution 5, as it seemed to only get too slow if you really did a large time span.
A screen recording drags a time slider under a world map of pentagon cells. The cells recolour as the window moves, with a short pause after each step.
Then I woke up the next morning and remembered that I wasn't using deck.gl yet, and that there was a pretty good chance that using it would make everything work a lot better. So I plugged it in and it crushed it.
A screen recording drags the same time slider over the same world map, with deck.gl doing the rendering. The cells recolour without a pause, and a readout in the corner reports the time each frame took.
This does mean I likely have more headroom to either put in finer cells or more data, so I hope to try that out in the future. One angle I'm most interested in is the ability to filter the views based on different attributes - sensor, day/night, confidence, etc. This makes the aggregation a lot heavier with the PMTiles approach, but I believe tighter time chunks, like 90 days instead of a full year, would fit in more of that data.
I did have one iteration where I drove the statistics for the map based on the Parquet A5 aggregation file. It was a promising direction, that did improve things, but I decided to go back to the pure PMTiles approach so that the viewer isn't super custom. I want any client to be able to read the data, and I don't want a nice viewer to require a bunch of super custom code. And once I brought deck.gl in it got things fast enough that additional performance wasn't really required, so shifting back to the more straight forward approach made sense.
But there's an additional optimization I didn't pursue, which is to use Parquet and not even send the geometries. This makes for even less that you send over the wire, and reduces duplication. In my day job at Planet I prototyped this and it worked quite well, so I may bring it back into a future iteration of this project, or another project. It might enable the goal of filtering on more than just date, especially combined with narrowing the time range. I've also found that you can get things to feel even faster if you manage to take advantage of the browser's cache, with good cache control headers. You can get some speed up with PMTiles deploying on CDN and splitting into xyz tiles, as each tile can get cached by the CDN and the browser. And if you make a small Parquet file with all the data needed then it can get downloaded once and then the next loads will be near instant. So I may try out a parquet partitioning scheme with aggregates that can handle global datasets in the future.
The other fun challenge was the time slider. This probably took the most time, as I wanted the zooming in and out to feel continuous - temporal on the surface, but in the background loading the right data. I don't think it's yet 'perfect', but I got to my goal of just having one time line that loads the data as you explore. I had to cut myself off from just continuing to code on this, but if I get back to this I think I'd make the time chunks shorter. Each of these is a whole year, so it takes some time to load. And I believe shortening would open up additional space for filtering by other columns, which I think is important to turn this into a truly useful application.
And I'll close out this section with a tip for anyone going hard with requests
to PMTiles or GeoParquet files - pass cache: "no-store" on the range requests,
as Chrome serialises concurrent Range GETs to the same URL behind its HTTP cache
lock, so lots of requests just end up waiting. See the source
code
of the app for more details - the PMTiles javascript library uses this
workaround on Windows, but for some reason doesn't do it for other OSes, though
it definitely hits macOS.
What stands out
This project exceeded my expectations for how far it's possible to go with cloud-native formats and tooling. I was confident having the data in cloud-native formats would make it much more accessible with better bulk access and no API key required. It's great for agents and users who know tools like DuckDB and GDAL, as you can get the data with little friction. And I'd be interested to see if it could fully replace the current download flow in FIRMS.
A screen recording works through the FIRMS archive download form. It selects a world region, ticks sensor checkboxes, types a date range, and submits the request.
We'd need some additional tooling to give people the full range of shapefiles, csv and json of specific regions. But I'm pretty sure a small bit of tooling could enable on the fly processing directly from the GeoParquet source and match the same workflow, likely for a fraction of the current costs.
But what surprised me was how responsive the app could get with a few iterations. The FIRMS viewer is quite nice, but I think this experiment proves that there are some newer techniques that could likely make it more compelling. Though I will be the first to admit that the current application I've built won't be a truly useful interface for understanding fires unless it continues to evolve. I'm not a routine user of FIRMS data, and my main goal was just to explore the interactivity that's possible with cloud-native geospatial. But if there is anyone who would like to help turn this into a truly useful tool and thinks it would get some traction let me know - I'd love to iterate with users or developers who are deeper in the fire world than I am. Halfway through building it I did talk to someone who does use the dataset, and they said that the 'confidence' value is really important. So next I'd like a view that does the typical 'thinning' of PMTiles on some combination of confidence and fire radiative power, to show the 'most important' fires. I have ideas, like enabling more filtering of data, bringing in satellite imagery, adding geocoders and improving the performance. But I'd like to understand what would actually be useful.
And then the other two points that I will be on like a broken record with Portolan. The first is the cost, and the scale you get for that cost. The whole dataset, in both PMTiles and GeoParquet, is ~27gb, which on AWS costs $7.44 to store per year. The other cost is 'egress', which is measured on the total number of bytes accessed. For egress we can query the public visits to the NASA FIRMS site, as it participates in the federal Digital Analytics Program . Last year there were 13,245,587 visits, and if we extrapolate out from the actual usage of the app then one guess is $5000 a year (I'll soon work on a cost calculator that makes it easy to plug in different values). And it will scale to handle millions of users at once, as there is no server that can go down - everything is just reading the data and all the interactivity comes on the client side.
And the second is that this enables full AI analysis of the data. You can ask about trends in different countries, and even join with other datasets. That is easy if they are in Portolan catalogs, and a bit less easy if they are not. I'm continually surprised by how insightful the results of these sessions are, as AI's have so much context around the spatial data. But the data grounds their answers in real truth - with the cloud-native geo + agents.md files of Portolan the agents can easily understand the real data instead of just hallucinating.
Thanks
Thanks to Planet for supporting my time and tokens on this one, and thanks to Source Cooperative for the data hosting, GitHub for the code hosting and processing, CARTO for the Basemap tiles, A5 for the sweet grid, PMTiles and GeoParquet for the formats, and deck.gl + MapLibre for the front-end.