Building Portolan: TriMet MirrorThree hours from shapefiles to a live catalog
كل المقالاتهذه المقالة متاحة بالإنجليزية فقط. بقية الموقع مترجمة.
So this is the first post in what is hopefully a collaborative series on the Portolan blog. The idea is to show off some of the cool results of Portolan catalogs that have joined the registry, and to share how they actually got built. In these early days of Portolan it will likely cover ecosystem and spec changes that came out of working with the data. My hope is that Portolan grows into more than a set of tools and a spec - that it becomes a big community of people working to make geospatial information more accessible. Together we can experiment with new ways of not just organizing data, but also presenting it. Think apps, chat interfaces, maps, and hybrids of all three.
Five minutes before boarding
I'll kick things off with a Portolan mirror of Portland TriMet's open data. TriMet is the transit agency for the Portland, Oregon region, and they have a really special place in my heart as they were the very first customer of 'GeoServer Enterprise Edition'. It was the first product I ever launched, and having such a respected government agency as a first customer was huge. A month or so ago I was flying out to visit my family in Oregon, and had set up a visit to see Bibiana McHugh , who led that first purchase, and also pioneered GTFS and OpenTripPlanner .
They've always been leaders in open data, and I'd long been a fan of their nice simple page that makes it easy to just 'get the data':
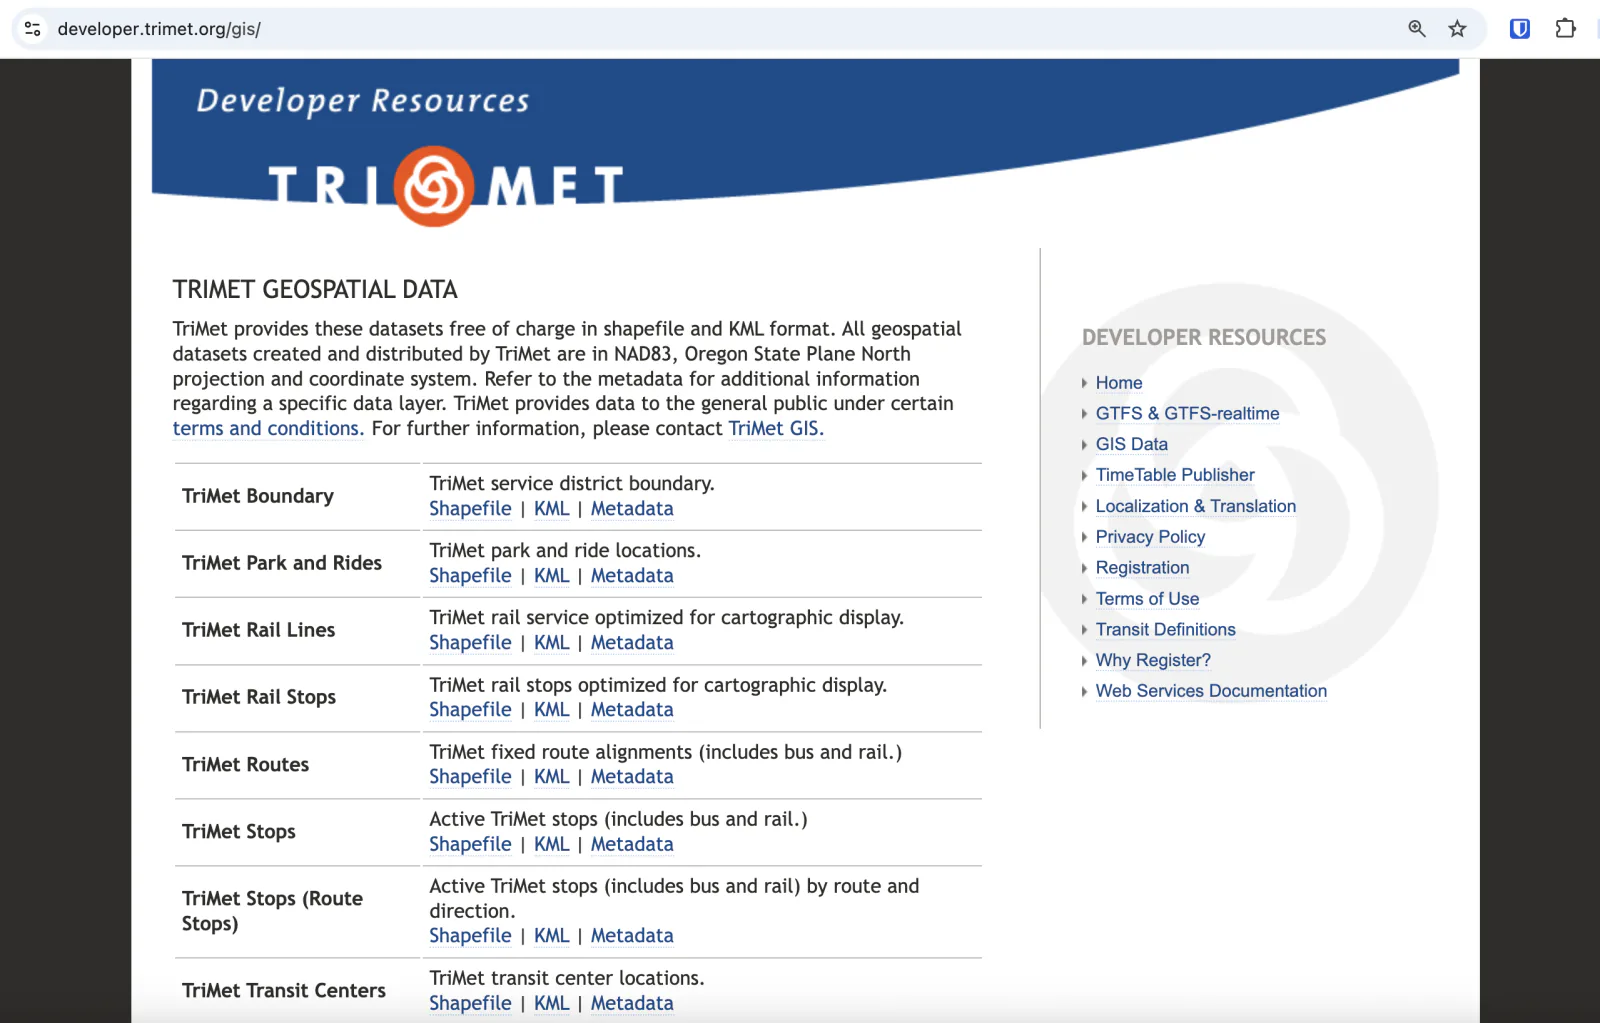
To me it's way better than some managed 'portal' with all kinds of (often unmanaged) tags and categories, that costs real money to run and maintain. But I was curious if we could 'upgrade' it with Portolan - retaining the simple spirit of it and keeping it all as just files that anyone can download, but making it more interactive and more accessible for AI agents. So 5 minutes before I boarded my flight I put this prompt into Claude:
can you make a complete portolan catalog from the 8 datasets at
developer.trimet.org/gis/ - use the latest portolan spec from
~/repos/portolan-spec and add 3-5 styles for each entity, based on
analysis of the data, plus great agents.md files as described in the
spec best practices. Do include links to each of the original shapefile
/ kml /metadata, and then adapt to pmtiles / geoparquet and mine the
metadata. Do research anything else you can find about these datasets,
to include more context. And be sure to include trimet logos in the
catalog.
Thankfully I was on Delta, with free wifi, so I was able to iterate away with Claude on the plane, and a couple hours later I had a fully working catalog along with a custom Portolan Browser themed to match their aesthetic. And the results were quite compelling - you can explore yourself at cholmes.github.io/trimet-data-browser .
A screen recording moves through the TriMet catalog in the Portolan Browser. It opens the catalog home, steps into several data layers, and shows each layer on a map in TriMet colors and fonts.
Every data layer got its own page, with a set of styles that highlighted the data - these are part of the catalog and downloadable, ready to drop into your own apps. The columns were documented, and since these datasets were all quite small they fully fit in the 10,000 row limit for the 'data preview'.
A screen recording shows the data preview for TriMet route stops. A reader types in the filter box, sorts columns, and clicks a row to see that stop drawn on the map.
The 'data preview' name undersells it, as you can interact with the entire dataset - filtering and sorting it for what you're looking for, without leaving the browser. And you can even click on the row and see the geometry in context. We put a 10,000 row limit on this one, but there are other ones that can handle even larger amounts of data.
The gory details
So I was quite happy with the results. I'm going to now go deep into the details, so if you don't actually care about how these catalogs get built then feel free to jump past this section. For those who are really interested, you can see my complete session with Claude in this markdown file . One thing to note is that this used an early version of the Portolan Skills , and we've refined those based on what we learned from this session, so I believe trying this again would need less than a third as much prompting. Today I'd likely just start with a simpler prompt to 'make a complete portolan catalog from the 8 datasets at developer.trimet.org/gis/', as most of the specifics I spelled out are now part of the skill itself.
Git-backed catalog
This was also one of the earliest 'git-backed catalogs', from before we added it as a best practice in the spec . Read the full best practice for all the details. In short, you store the 'non-data' (STAC catalog.json, AGENTS.md, README.md, etc) in a git repository, along with the scripts that format your data and publish it. The data itself stays out of git, since it would bloat the repository, but all your other changes get versioned. And the scripts should enable complete reprocessing of the data if it gets messed up. This method has emerged as essential when working a lot with AI agents, as you can be confident that if it messes something up you can roll it back and not lose everything. You can see this catalog at github.com/cholmes/portolan-catalog-trimet . We also added a way to link a catalog to its repository . Our hope is that in the future this can enable submission of issues where people can report problems with the catalog, and pull requests where people and agents can directly propose improvements. We see a future world where the agents reading catalogs can be checking for issues and report them back or directly improve the catalog being queried.
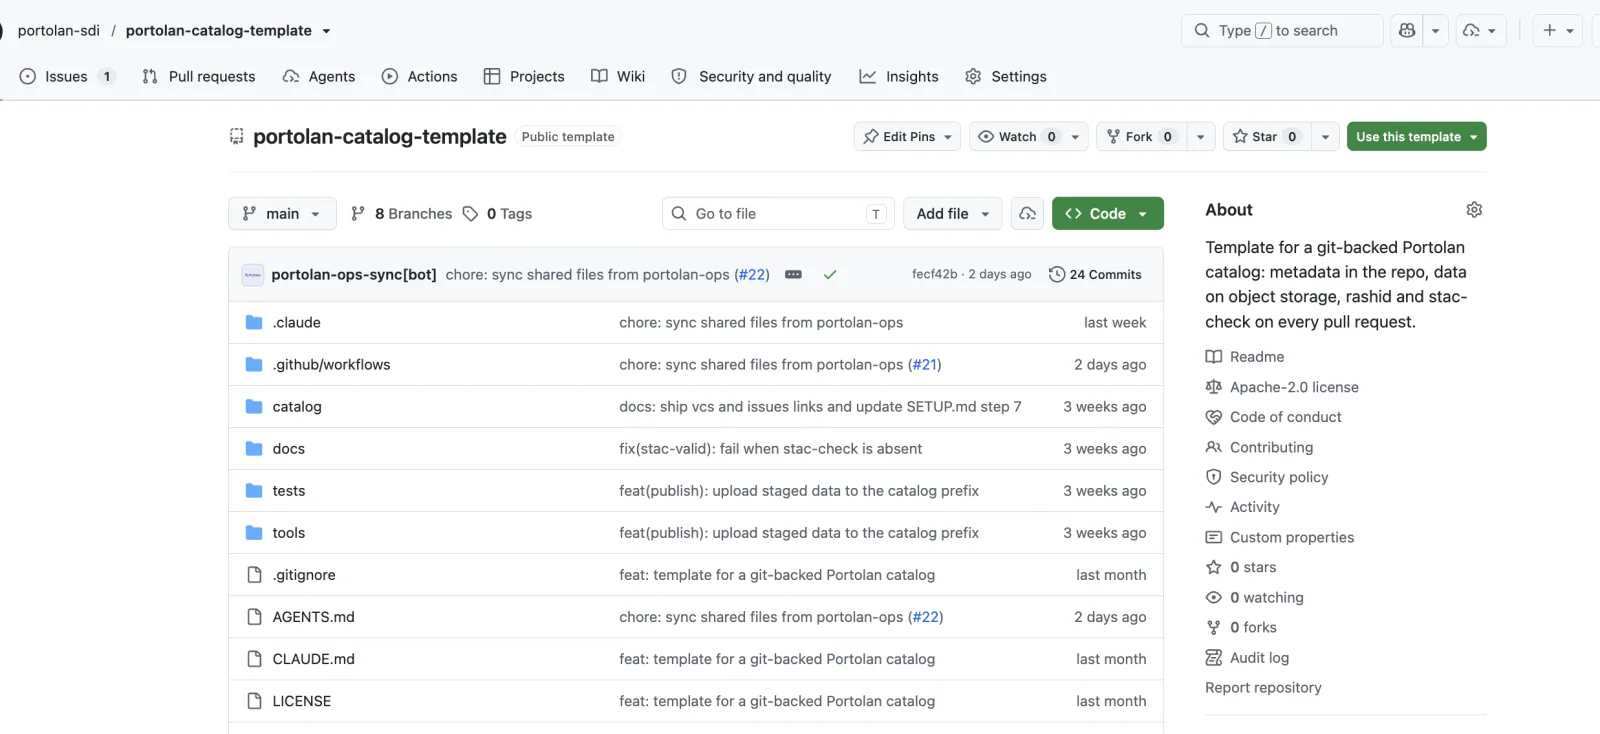
We put together a 'template repository' that makes it easy to start a repo with all of these practices incorporated - you can just clone it and adapt to your needs. The other key thing the template sets up is the continuous integration (CI) that runs rashid and stac-check on all edits, which catches invalid metadata on every pull request. This catches a lot of errors, and is highly recommended.
Custom-themed browser
The other thing that was fun for this one was really tweaking the browser to match TriMet's styling. I started with my Portolan Browser fork , though to be clear most all the work on that is due to Matthias Mohr evolving STAC Browser to be a great product - my fork is just some customizations on top. Way back in the prehistory of STAC Browser I was always excited to have it be customized - that each org would run their own STAC Browser instead of everyone just using the publicly hosted one. But it never happened much. I think initially it wasn't that easy to do, but even with improvements that Matthias made to make it easier we still didn't see a lot of custom ones. I believe AI coding tools will change this, as it was so easy for me to change it to how I wanted it to look. I just pointed Claude at the developers page, and also the TriMet home page, and it ended up quite close. Their developer site and their home page don't quite match, so I leaned toward the developer one, using its fonts and colors a bit more, as that felt like a closer fit. But this was the first time I tried to really stretch the styling, and it was cool to see how easy it would be for an organization to customize the browser to completely match the look and feel of their other properties.
Custom-basemap styling
One last customization, enabled by TriMet being great open data citizens, was to use the exact same basemaps as their own applications. They run their own tile server at tiles.trimet.org , and publish every style they use, including 3D and satellite views. So it was super easy to pull in their basemaps, instead of using the generic basemaps of STAC Browser. This really makes it feel unique - I wish more organizations would customize their map tiles. This is now super easy to do with Claude plus vector tiles, so I hope we start to see more of it.
What stands out
Ok, pulling out of the gory details. The thing that strikes me most is how easy this is to do. I spent no more than 3 hours on the entire project, building both the catalog and the custom data browser. Most of it ran independently on the plane, and then I did some iterations on the results. I'd guess that doing the same project with the progress we've made in the last month would make it less than an hour of work to get to where I did. Yes, you need Claude or another capable agent, and it's probably a few dollars worth of tokens if you're paying API list rates. The agent is most of what makes this so easy, but it's also the simplicity of the output - all the agent needs to do is format the files right, and then all the cool tooling 'just works'.
Then there's the cost. I ran some analysis of the cost to store the data and serve it up. The cost to store 7.6 megabytes of data at S3 standard list prices of $0.023 per gigabyte per month is $0.002 per year. Yes, you read that right. This is a particularly small set of data, but even if you had 1000 times this amount of data it would be $2.00 per year to store the data. The bigger potential cost is 'egress', the only other thing charged for storing data on the cloud. This is an amount charged for the total bandwidth downloaded by users. For interactive map views of this data the cost depends on the actual traffic, but a busy government site of 20,000 map sessions (142 gigabytes transferred and 1.7 million requests) a month would be $4.45 on AWS S3. But put a content distribution network in front of it, or host on Cloudflare R2, which doesn't charge for egress, and it'd be $0. If you went fully viral - 5 million people showing up after a front-page Reddit post - then a month could be $3000 if it's on S3, but on Cloudflare R2 it'd be $150. With a traditional ArcGIS Server or GeoServer setup this would be at least ten times as much, and more likely would just crash the site unless advanced auto-scaling was already in place. We'll be working on a cost calculator to let people play with their numbers and see what it would cost on common cloud-providers, including sovereign ones like Hetzner or Leaseweb.
And the data is also now completely 'AI-enabled'. I'm not going to do a deep dive on this now, as on the Portolan Blog we'll dig into more examples of what this means, but I'll give a brief overview. And in the future I'll try to circle back on this data, as there's a couple other Portolan catalogs I want to get up first to show how you can do really interesting queries across TriMet, Portland, Oregon and national census data. But you can see my early experiments - I prepped a couple datasets into a local Portolan catalog and then was able to ask questions about shade, car ownership, transit equity and more, and got insightful responses back.
A screen recording shows a chat with an agent about a local Portolan catalog of TriMet data. The agent answers questions about shade, car ownership, and transit equity, and builds a map for each answer.
With just a few questions Claude made four different maps for me, each illustrating the thing we were talking about and letting me explore the data myself. I think we'll see more custom maps in the future, but what I liked most is that it's more of a conversation about what the data shows, and the map isn't the point, it's more supporting evidence and a tool to explore more. You can explore the conversation I had and the maps it built at 9eo.org/demos/trimet-chat/ . My hope is that the expertise provided by great data, made accessible in Portolan catalogs, can make it much easier for non-GIS people to get geospatial insights.
Thanks
Thanks to TriMet for publishing clean, well-documented open data for this long, and to Bibiana McHugh for the visit and general leadership of open initiatives. Thanks also to Matthias Mohr, whose work on STAC Browser is what the Portolan Browser is built on. The custom theme featured in this post is a few hundred lines on top of what he has already built.